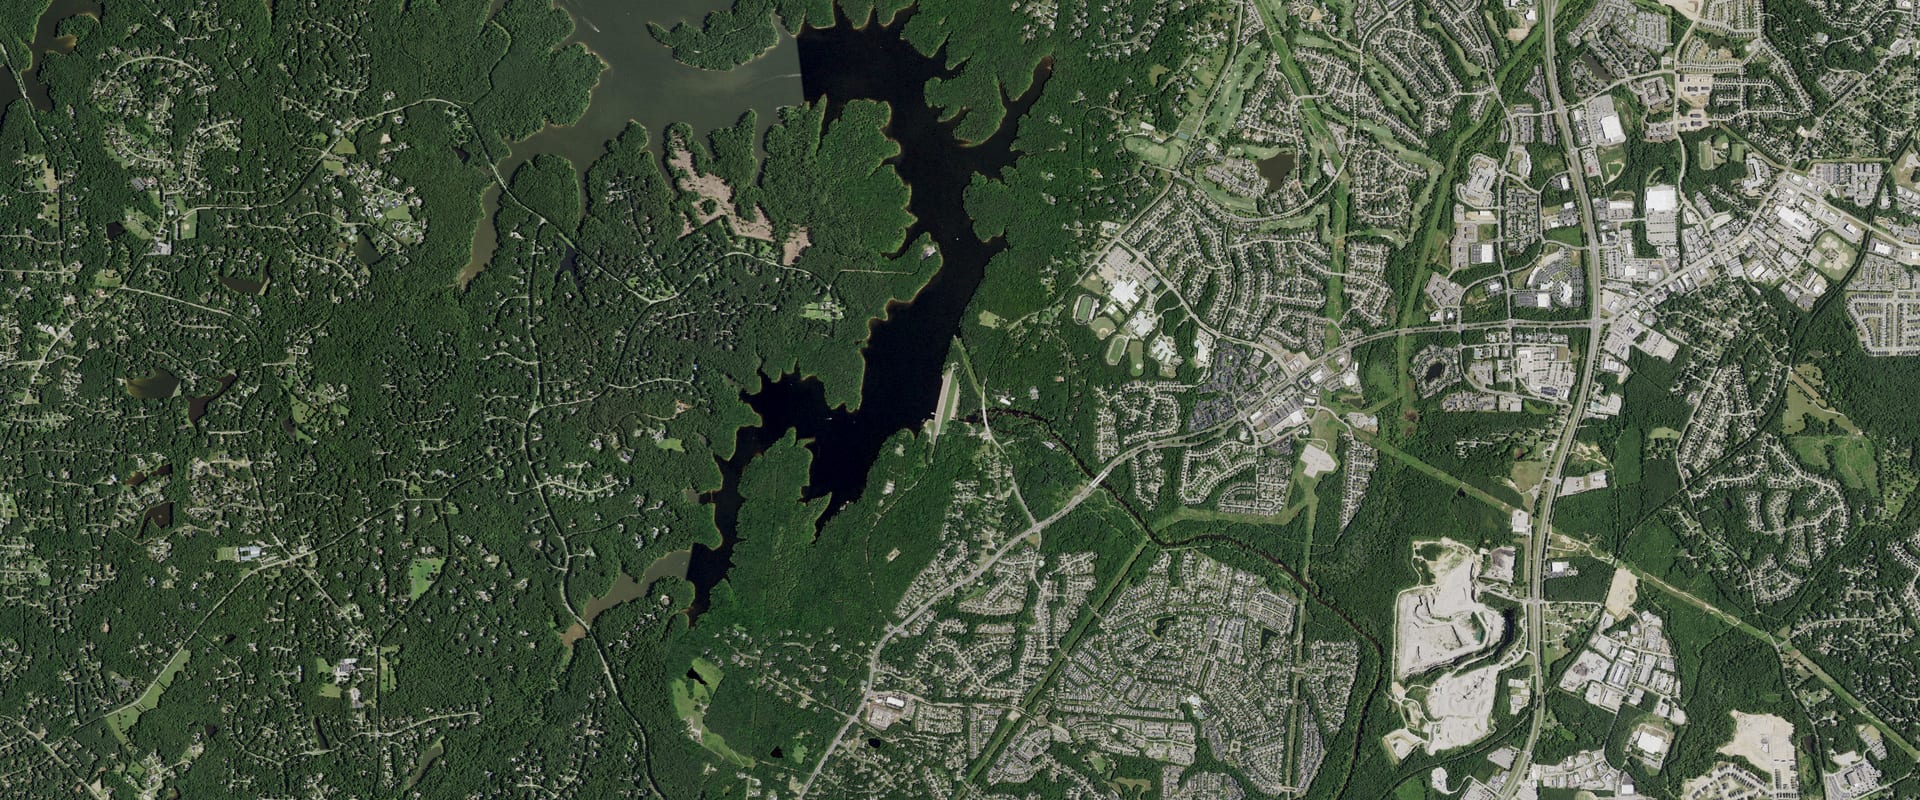
Falls Lake Water Level & Temperature Today
5.8 ft below full pool, 44.0% full, and 4.2 ft lower than a year ago.
Read Oct 26, 3:00 PM EDT
Trend and source week, month, year
Source: U.S. Army Corps of Engineers. Check it at waterdata.usgs.gov/monitoring-location/02087182/
Which Falls Lake ramps work at 245.7 ft
9 of 10 ramps are usable at today's level, 0 marginal and 0 out of the water. This is our own comparison of today's level with each ramp's pool range in the Corps' data; the Corps doesn't publish an official minimum pool, so treat it as a guide and check with the park.
- Beaverdam Usable
2 lanes · works with the lake between 243 and 0 ft
- Bw Wells Usable
1 lane · works with the lake between 236 and 0 ft
- Eno River Usable
1 lane · works with the lake between 242 and 0 ft
- Hickory Hill Usable
4 lanes · works with the lake between 232 and 0 ft
- Hwy 50 Sra Usable
6 lanes · works with the lake between 232 and 0 ft
- Ledge Rock Usable
4 lanes · works with the lake between 241 and 0 ft
- Rollingview Marina Usable
2 lanes · works with the lake between 240 and 0 ft
- Rollingview Sra Usable
4 lanes · works with the lake between 240 and 0 ft
- Upper Barton Usable
4 lanes · works with the lake between 235 and 0 ft
- Holly Point
2 lanes · works with the lake between 0 and 0 ft
Ramp locations and pool ranges: U.S. Army Corps of Engineers (district GIS layers); the status is Creek & Lake's computation. Level: read Oct 26, 3:00 PM EDT.
Falls Lake, North Carolina. Run by USACE Wilmington District.
Falls Lake level
Daily level, past 12 months, feet above sea level (NGVD29). Shaded: the normal range, the middle half of readings for each date, 2007 to 2025. U.S. Army Corps of Engineers; 25 days from the U.S. Geological Survey.
Monthly average since Sep 30, 2007; gaps where the record is missing. U.S. Army Corps of Engineers; 2,106 days from the U.S. Geological Survey.
Falls Lake water temperature
65.8°F on Oct 26, the latest daily value from USGS gauge 02087182. USGS 02087182, Falls Lake above dam (in-lake site).
Daily water temperature, degrees Fahrenheit. U.S. Geological Survey.
About Falls Lake today
How full is Falls Lake?44.0% full, 5.8 ft below full pool
44.0% full by storage on Oct 26. Conservation pool between the top of inactive pool (236.5 ft) and the top of conservation (251.5 ft), both priced from the Corps elevation-storage table (2015). The CWMS storage levels (131,395 / 25,073 ac-ft) come from a different survey and disagree with the table by about 4%, so they are not mixed in.
Full pool is 251.50 ft, the operator's target for this time of year.
How low is Falls Lake?4.2 ft above its lowest since 2007
5.8 ft below full pool. The lowest daily level in our record since 2007 is 241.55 ft, on Dec 25, 2007.
Is Falls Lake still dropping?Yes: down 0.45 ft this week
| Change | Feet | Level then |
|---|---|---|
| Past day (since Oct 25) | 0.08 down | 245.81 |
| Past 7 days (since Oct 19) | 0.45 down | 246.18 |
| Past 30 days (since Sep 26) | 1.35 down | 247.08 |
| Past year (since Oct 26, 2025) | 4.15 down | 249.88 |
Why is Falls Lake low?Drought
Drought: Falls Lake rose with July rain, then started falling again as dry weather returned.
“The level of Falls Lake in Durham, Wake and Granville counties, which had increased due to heavy rains in July, has started to decline again.”
Source: North Carolina Department of Environmental Quality (drought update), Aug 20, 2026; a state agency, not the operator.
Normal for Oct 26 is 250.05 ft: the median of 132 daily readings within 3 days of this date, 2007 to 2025. Falls Lake is 4.3 ft below it.
When was Falls Lake last full?Sep 8, 2025
The last day in our record at or above 251.50 ft, today's full pool.
Falls Lake full pool level251.50 ft
Full pool changes with the season; this is the operator's target for today. Elevations are feet above sea level (NGVD29).
Where it comes from: USACE CWMS location level "NEU FLP.Elev.Inst.0.Top of Conservation" (refreshed daily; seasonal where the Corps sets a seasonal pool). Checked 2026-10-24. 251.5 ft.
Falls Lake this time last year249.9 ft on Oct 26, 2025
4.2 ft lower than a year ago.
Levels: U.S. Army Corps of Engineers, read Oct 26, 3:00 PM EDT. Normal and records come from Creek & Lake's stored daily history (6,958 days since 2007); they aren't official unless the operator publishes the same value.